Learn how to use LabOps to monitor your lab, jobs, and adapters.
This article will explain all the different states Artificial reflects so you can monitor your lab, jobs, and adapter health from anywhere.
Monitoring your lab
There are two ways to monitor your lab's state - the status bar and your Digital Twin.
Status Bar
In the top left corner, next to the Lab name, you will see the current global state of the Lab. This matches the state of the Lab you see on the LabOps Home page.

The Lab State is dictated by the most "urgent" job state, so you know if you need to take action to get all of the jobs in a running state.
Potential states are (in order of urgency):
- Error - at least one job is in an error state
- Assistance Needed - at least one job requires completion of an Assistant
- Paused - at least one job is paused
- Running - all jobs are actively running
- Ready for work - no jobs are running
So, if a job is in "Assistance Needed" and another job is in "Error," the lab state will reflect "Error."
The Status Bar also includes access to the System Monitor, which provides information on the health of adapters deployed on Artificial and logs such as messages about device states, details on errors, and other critical information. This is particularly helpful for troubleshooting any errors the job might have encountered.
Digital Twin

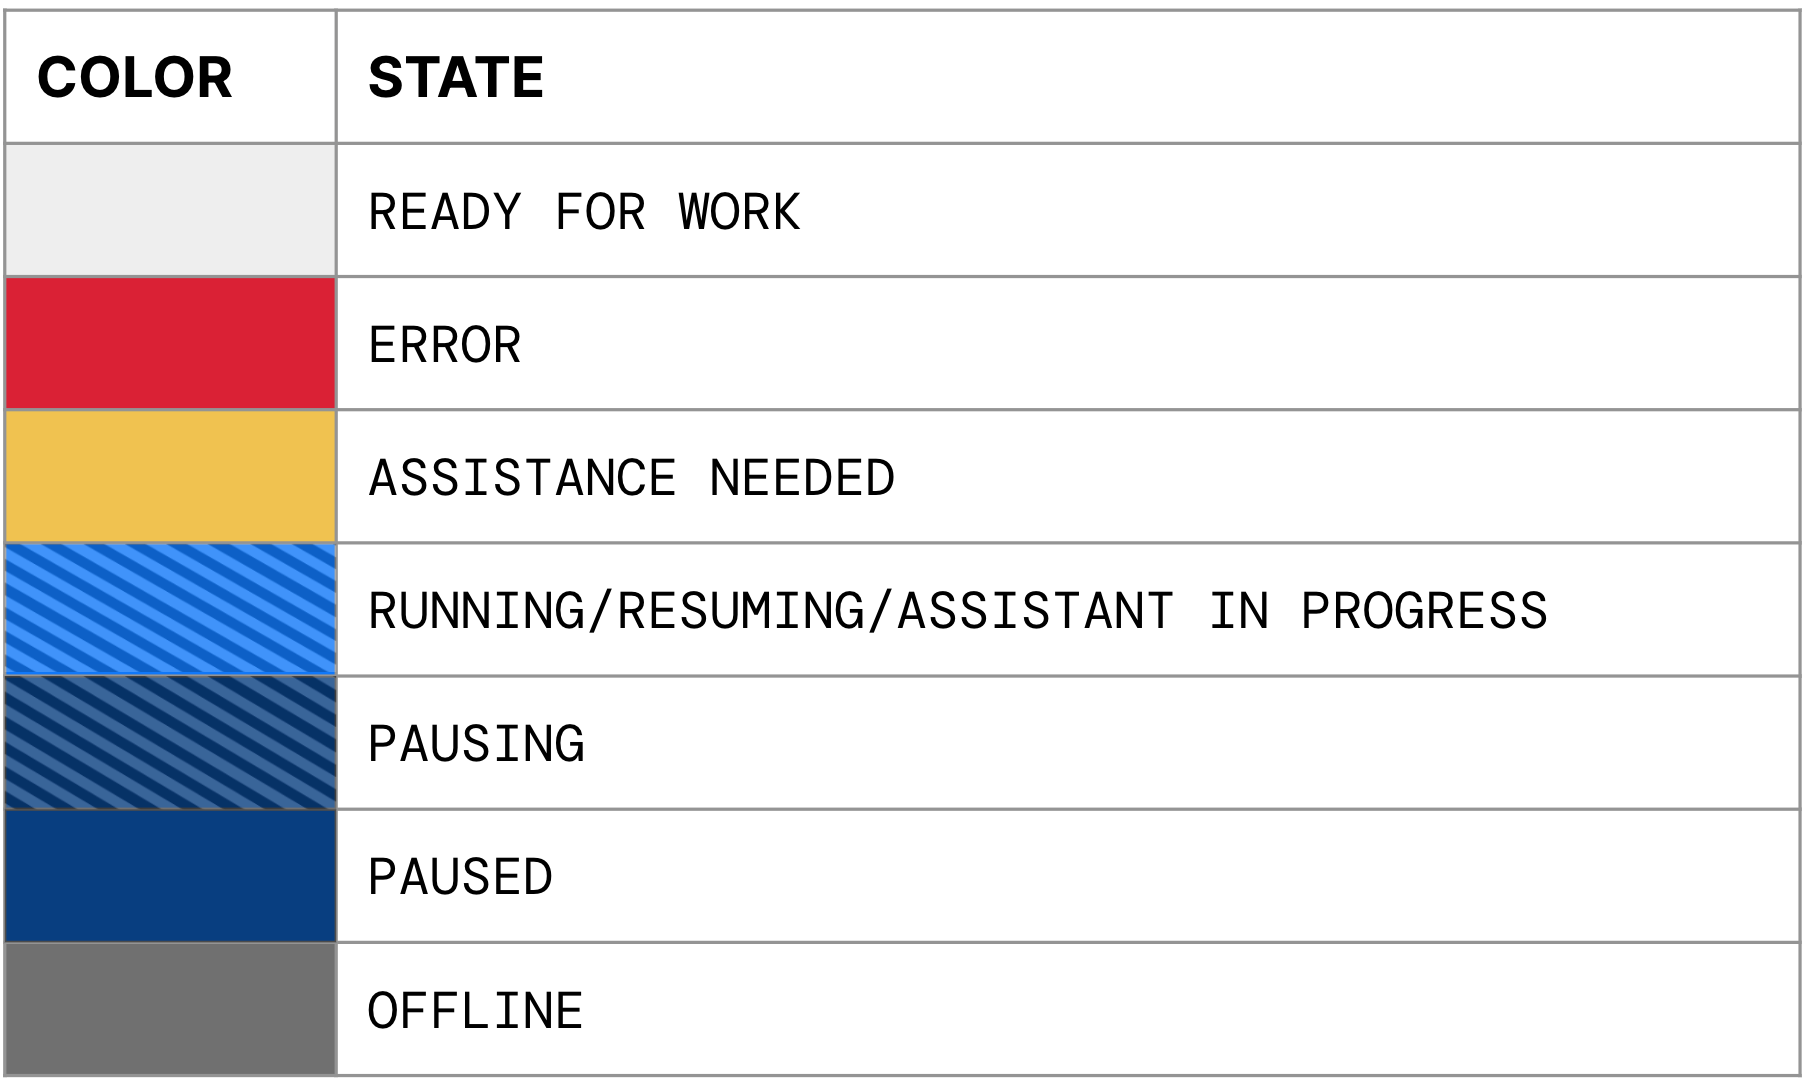
You can monitor the state of instruments with color overlays on the Digital Twin. All of the potential states and their color are shown below.
The Digital Twin also visualizes your plates throughout its journey. You can access this search functionality by clicking the cube icon and searching by barcode to locate it.
Monitoring Jobs
Like our Lab and Assets, jobs have different states depicted by their respective colors, as described below. 
Active jobs are in progress on the system and may be in one of the following states: Running, Paused, Assistance Needed, Assistant in Progress, On Hold, and Error. Active jobs can be viewed from the LabOps panel, which includes a Job Metrics section and a Recent Jobs section.

The Job Metrics section provides the number of jobs currently in the following states: Error, Assistance Needed, Running, and Paused. Clicking on the number in each category will open up a filtered table view of those jobs.
The Recent Jobs section has a list of all active jobs. Jobs are sorted with the same prioritization as Lab states:
- Error
- Paused
- Assistance Needed
- Assistance in Progress
- On Hold
- Waiting for Resource
- Waiting for Revocation Group
- Running
To learn more about a job, click on the job's row to open the job details panel. You can learn more about Job Details here.
To obtain a more complete view of all jobs, you can access this in the Table View. You can learn more about the Table View here.
Monitoring Adapters
![]()
The System Monitor provides the state of the Artificial connection and health checks for third-party connections. The top-level status provides a summary of these states with:
- ✅: Connected and operating as expected
- ⚠️: Warning, which indicates that at least one adapter is not working as expected but is somewhat operational
- ❌: Error, which indicates that at least one of the adapters has an error and is not working at all
This top-level state is determined by the enabled adapters in that lab.
- The top-level health may be ❌ error, if:
- Any enabled adapter is disconnected
- Any of the enabled adapters have an error in the health check
- The top-level health may be ⚠️ warning if:
- Any of the enabled adapters have a warning in the health check
- The top-level health is ✅ Connected if all adapters are connected with OK health checks
Upon clicking on the System Monitor in LabOps, a window will appear where you can see the state of the Artificial connection and 3rd party connection for all of the adapters. i
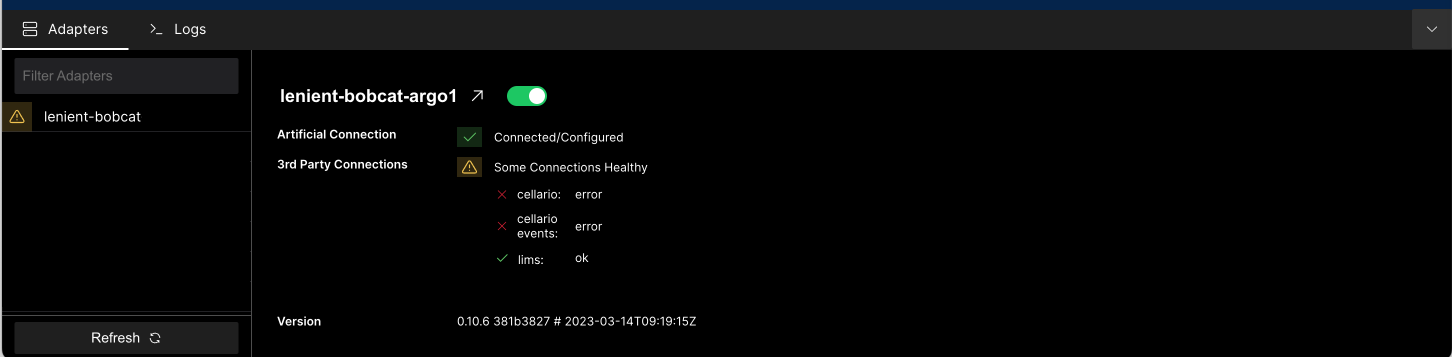
- The Artificial Connection reflects the connection state of the adapter:
- ✅: Connected, which means the adapter is running, configured, and running as expected.
- ❌: Disconnected, which indicates that the adapter is not running and we are unable to get health checks or information from the adapter
- 🚫: Disabled, which means that a user manually disabled the adapter so the code is not running.
- Adapters with this state are not considered for the top-level system monitor.
- ⚙️: Config Needed, which means the adapter configuration requires values that have not been set yet
- Health Checks reflects the state of the connection between Artificial and external systems such as LIMS, hardware, and workcells:
- ✅: OK and operating as expected
- ⚠️: WARNING, which indicates that the underlying system is not working as expected but still somewhat operational
- ❌: Error, which means the underlying system is experiencing an error and is not working at all
You can read more here to learn what to do if your adapter status is not green.
Learn more about LabOps by checking out these articles:
- Submit requests and schedule jobs and Assistants to run
- Take action and view details of specific jobs